Test view
The Test view module displays all information regarding the selected test and allows to edit the measurement setup and settings. The view of every tab depends on the test itself. This section just gives a general overview, for a specific test refer to the specific manual of a test. As well as any other module the Test sequence can be enabled/disabled in the menu, placed anywhere, automatically hidden or fixed in its position and stacked with other modules.
Input#
The test input tab displays the tests user interface with input parameters the user is allowed to adjust.
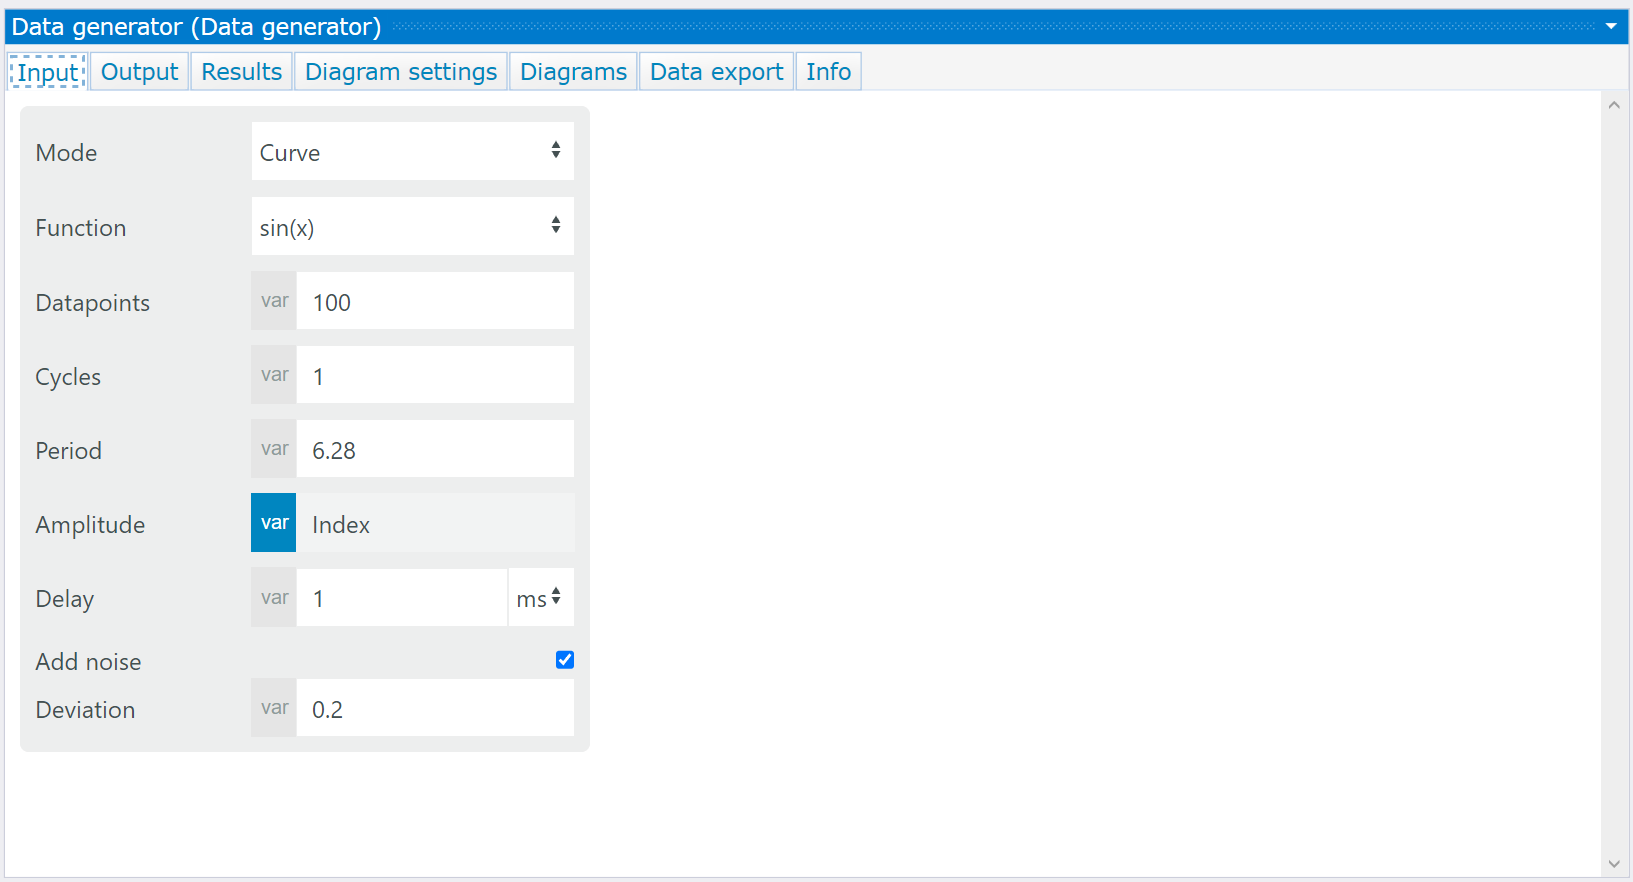
Test input example of data generator test
Output#
Test output parameters#
The test output tab enables the user to define captions for output parameters. Additionally limits can be defined which later can be used as a break condition. The user can set the minimum, maximum and define a fail bin for each parameter that allows a statistical evaluation and analysis of the frequency of occurrence for specific failures. If the limit of a parameter is reached, Measmatic offers the following continuations:
• continue → Measurement will continue even if the limit is reached
• stop → Measurement will stop when the limit is reached
• ask → User interaction required to decide individually for each case
Calculations#
Calculations provide mathematic functionality to add abstract and complex functions into a test and create a referable variable. In the formula editor the user can select from predefined mathematic functions and all test variables to create a new formula. By clicking apply, the syntax is checked and a valid formula will be added to the list.
| Icon | Description |
|---|---|
| Add a new formula to the table | |
| Remove a selected formula | |
| Move the selected formula up | |
| Move the selected formula down | |
| Opens the formula editor for a selected formula |
Table: Formula editor functions
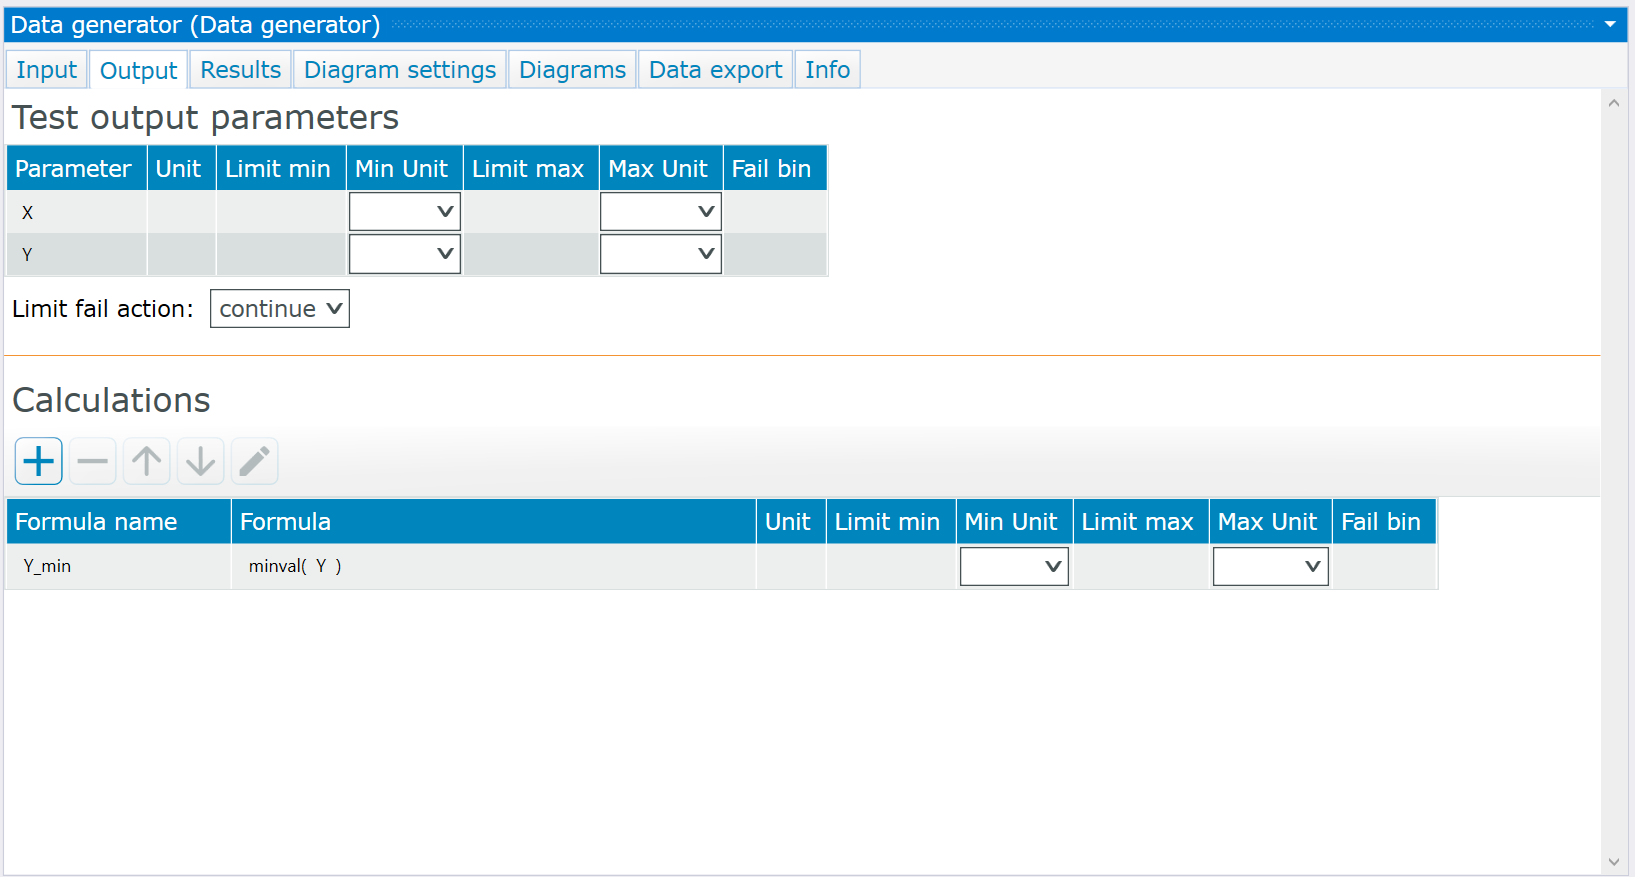
Test output example of data generator test
Results#
The test results tab displays a table with all measured values. For each parameter and measurement run an array of values is accessible in the table. By double-clicking a cell the curve data of the selected parameter will be displayed in a separate window.
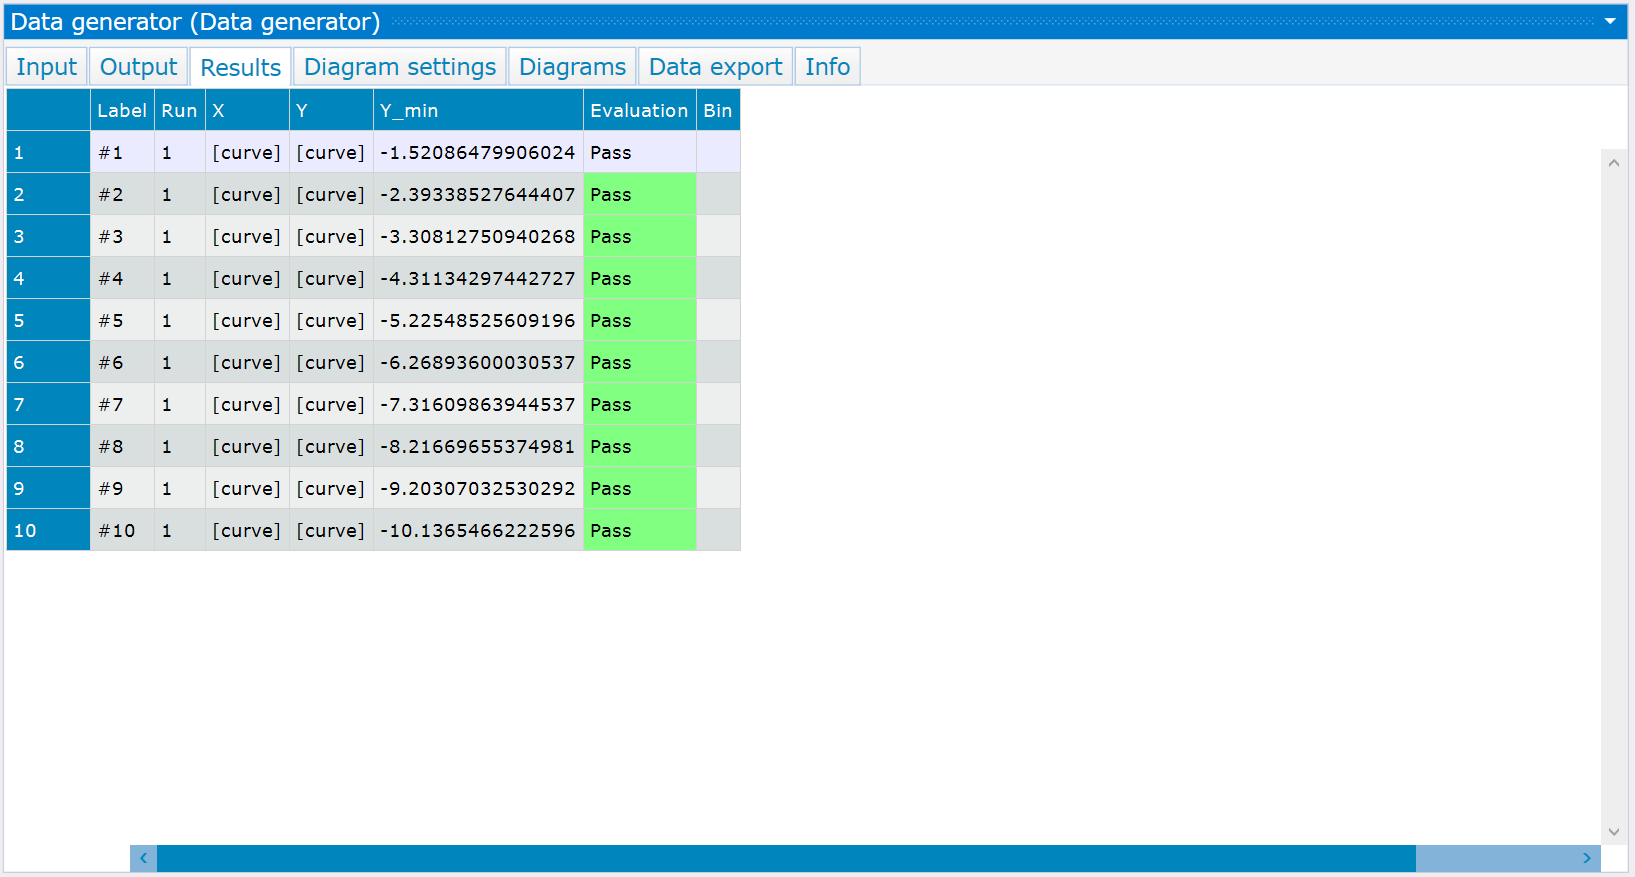
Test results example of data generator test
Diagram settings#
The diagram settings tab provides the setup of the diagrams to display the measured data in a chart. In the upper part of the tab, the user can define the diagram content. The bottom menu defines the layout of each diagram individually.
| Icon | Description |
|---|---|
| Add a new graph definition | |
| Remove a selected graph definition |

Diagram settings example of data generator test
| Header | Description |
|---|---|
| X Axis values | Selectable parameters from a Dropdown menu that will be assigned to the X-axis |
| Y1 Axis values | Selectable parameters from a Dropdown menu that will be assigned to the Y1 axis |
| Y2 Axis values | Selectable parameters from a Dropdown menu that will be assigned to the Y2 axis |
| Diagram | Selectable diagram from a Dropdown menu |
| Show error band | Displays the error band within the chart when enabled |
| Check error band | Compares the values from the measurement with the error band |
| Show reference curve | Displays the reference curve within the chart when enabled |
| Error X % | Allowed deviation from the X-Error band in percent |
| Error Y % | Allowed deviation from the Y-Error band in percent |
Table: Diagram Settings
Diagrams#
The diagrams tab displays all defined diagrams. Each diagram is separated into 3 different areas:
• Chart (Top Left)
• Chart Overview (Bottom Left)
• Measurement Values Table (Right)
The chart appearance can be changed depending on the requirements of the user. The chart overview always displays the full range of the values and displays the selected view when zooming in or out. The table on the right displays all measurement data. Every curve can be enabled or disabled, referenced with a unique user-defined name and a unique line appearance. The table can be filtered by the name or parameter unit to display only the important curves.
| Interaction | Function | Description |
|---|---|---|
| Left Click + move | Zoom In | Draw a rectangle within the chart to zoom min |
| Double Click | Auto-Scale | Reset the current zoom settings and activate auto scaling |
| Mouse Wheel | Zoom In/Out | Zoom in/out at the current cursor position |
| Right Click | Enable tooltips | Enables/disables the tooltip that displays the measurement values within the chart at the current cursor position |
| Enable crosshairs | Enables/disables a crosshair that displays the values of the current cursor position | |
| Show Axis settings | Shows the axis setting menu that allows the user to disable auto-scaling, enter fixed min and max values of the chart and select either a linear or logarithmic scale | |
| Save as image | Stores the current chart in a file (.png) |
Table: Diagram Interaction
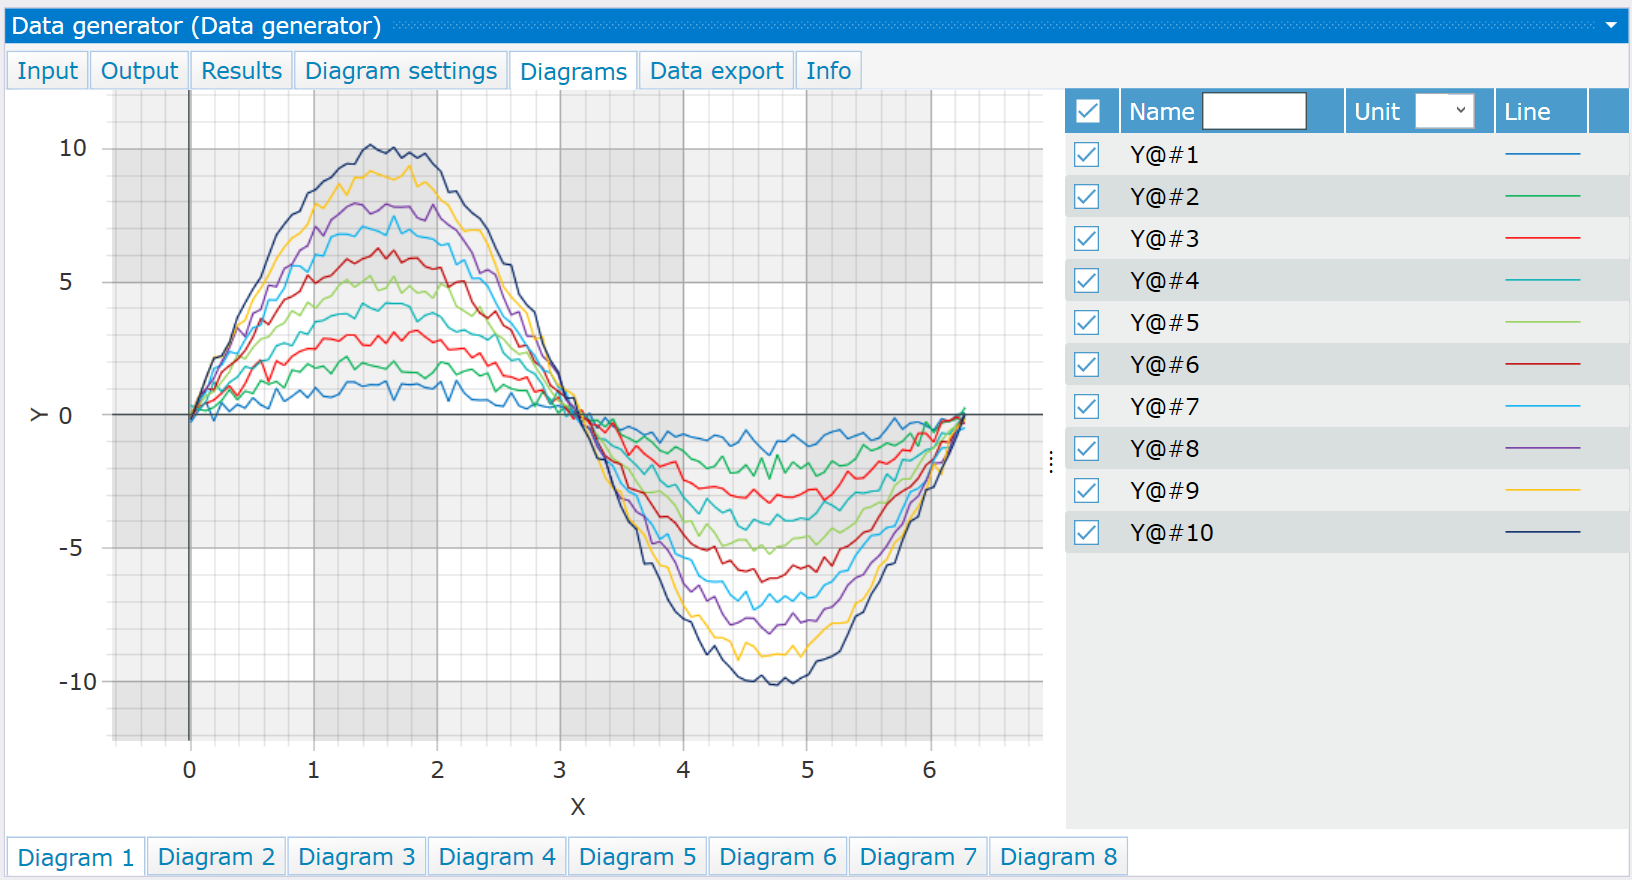
Diagrams example of data generator test
Formula editor#
In the formula editor the user can select from predefined mathematic functions and all test variables to create a new formula. By clicking apply, the syntax is checked and a valid formula will be added to the list.
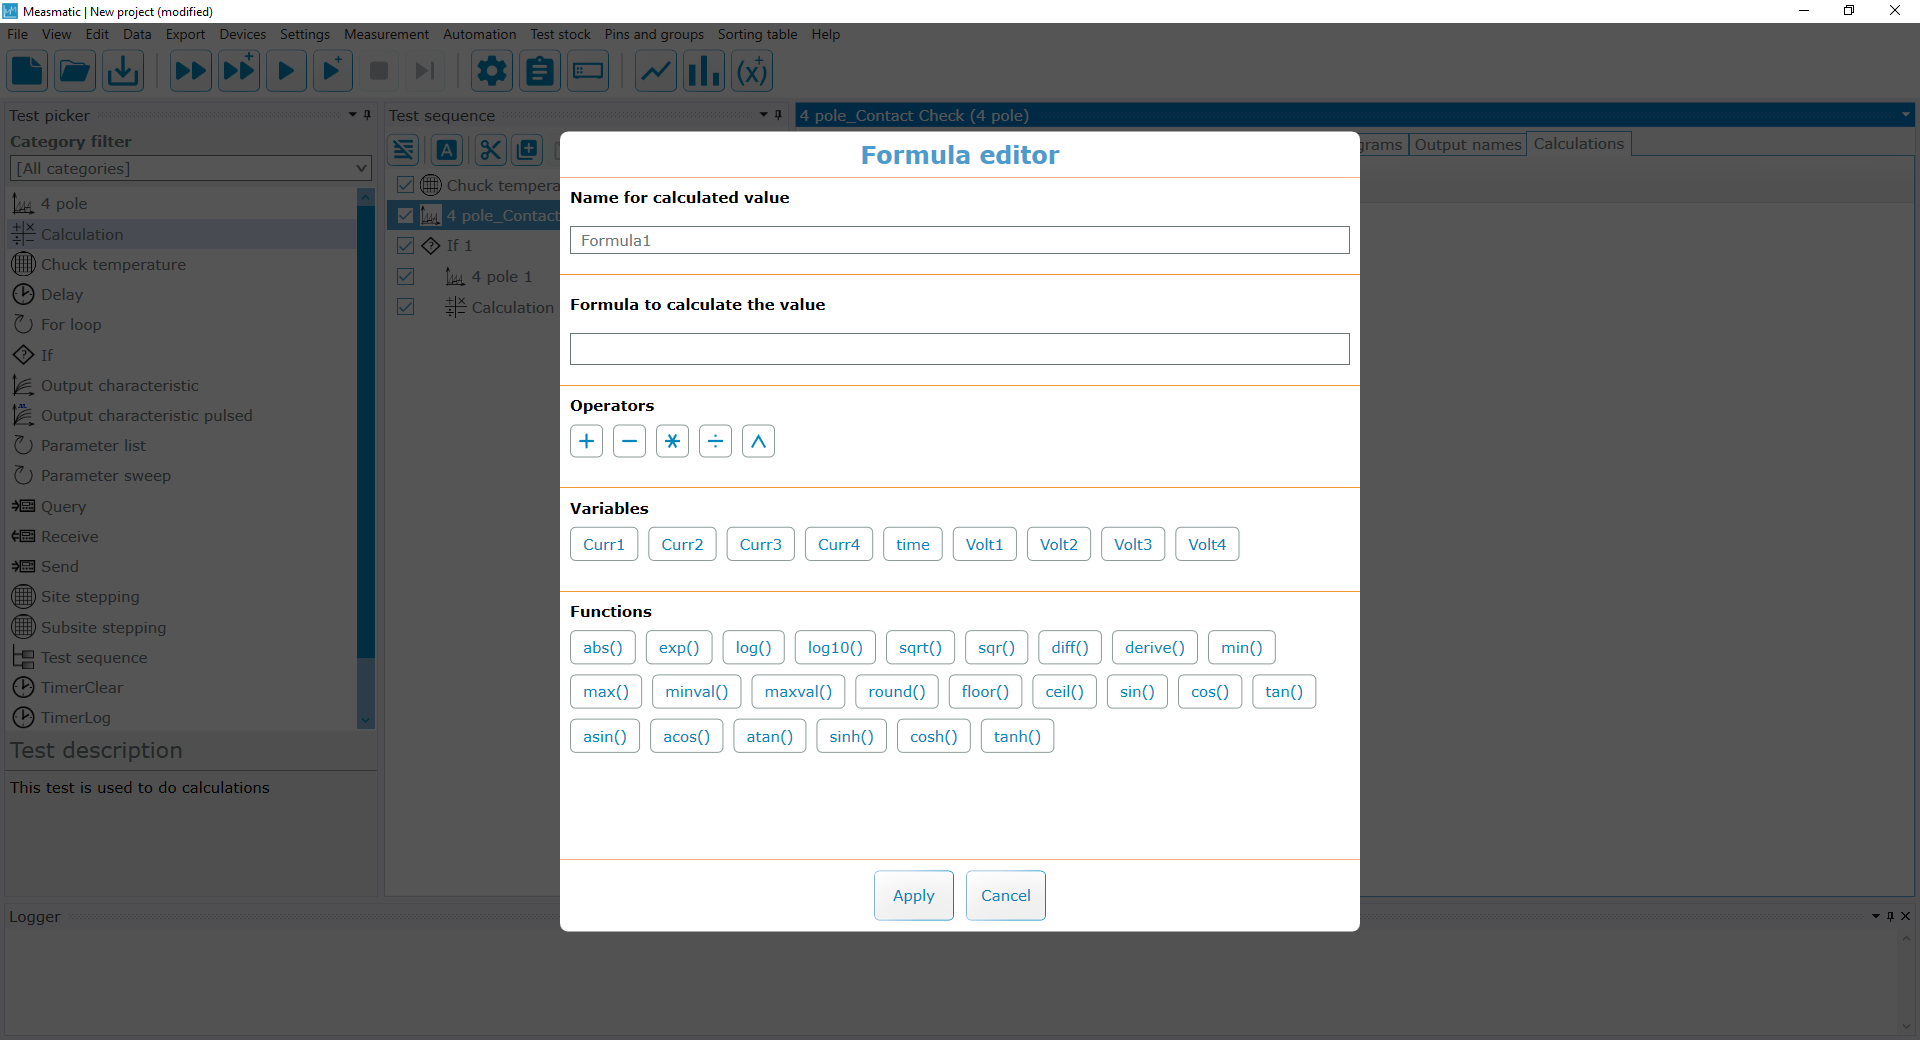
Formula Editor