8 Toolbar#
The toolbar provides quick access to the most frequently used functions and test interactions.
| Icon | Description |
|---|---|
| Create a new project (see new project) | |
| Open a project (see open project) | |
| Save the current project (see save project) | |
| Run all tests, previous measurement data will be overwritten (Shortcut: F5) | |
| Run all tests and append data (Shortcut: F6) | |
| Run a selected single test, previous measurement data will be overwritten (Shortcut: F7) | |
| Run a selected single test and append the data (Shortcut: F8) | |
| Stop the test execution | |
| Skip the current running test | |
| Edit the project settings (see project settings) | |
| Edit the measurement information (see measurement info) | |
| Open the Device manager (see device manager) | |
| Open the Switching configuration (see switching configuration) | |
| Open the Data Viewer (see data overview) | |
| Open the Statistic Viewer (see measurement info) | |
| Insert a variable as a parameter from the variable list | |
| Open the User manager to administrate all user accounts. This function is only available when user management is enabled | |
| Open the dialog to switch to another user account and/or level. This function is only available when user management is enabled |
Table: Toolbar
Measurement Information#
The measurement info is the overview of all general information to make a test identifiable. All of the information will be stored in the measurement data file in a separate node. The following indicators can be set individually by the user: Operator, WorkPlace, Lot, SubLot, BarCode, Batch, Wafer, DUT, Comment, Info1-3, GoldenDevice, Technology, Tester, Temperature, Environment If activated in the Project Settings, the dialog will pop up before the test starts and allows the operator to link the user-specific data to a measurement.
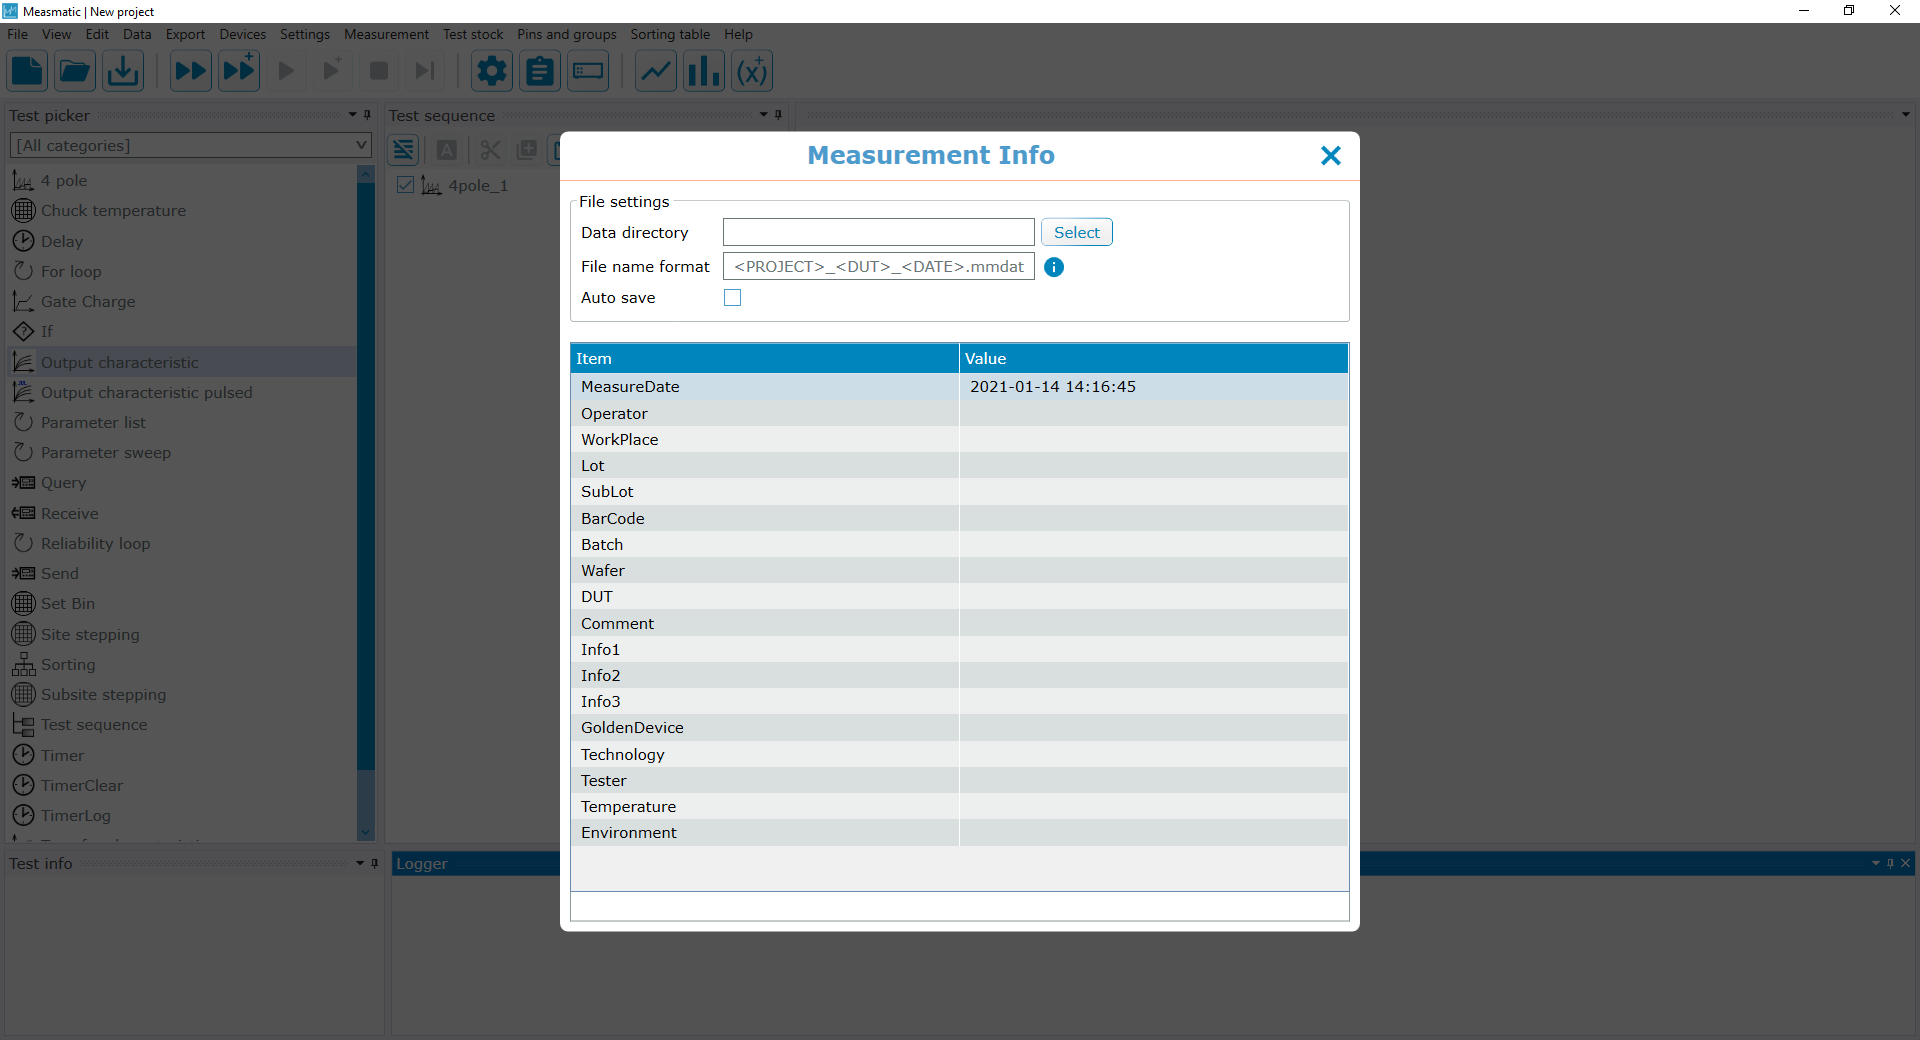
Measurement Info
| Function | Description |
|---|---|
| Data Directory | Directory where the measurement data will be stored |
| File name format | User-defined file name format for the measurement data file. Available placeholders are listed in the information menu beside the textbox |
| Auto save | If enabled, the data will be saved automatically after a test sequence run (refer to section 3.7) |
Table: Measurement Info
Data Overview#
The Data Viewer summarizes all measurements from the currently selected test. The table provides information regarding the Project, Test, Parameter and Label and Test date. The parameters can be enabled and displayed in the Chart by selecting a row and assign it to an chart axis. By right-clicking on the chart, the current selection can be saved as an image (.png).
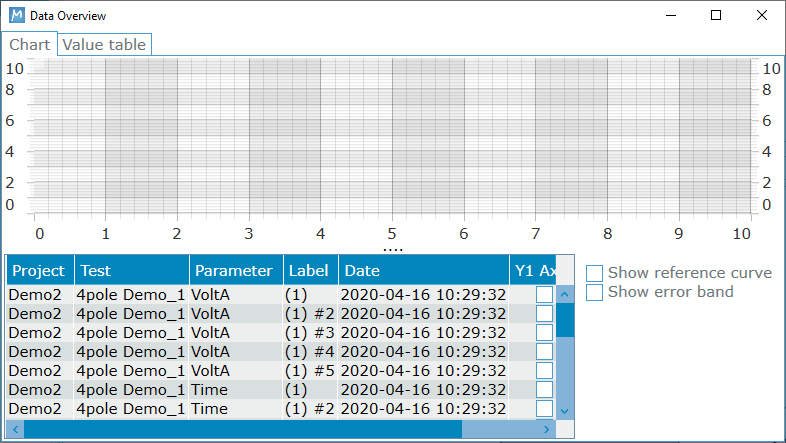
Data Overview
Statistic View#
The Viewer allows the user to compare the measurement values and check the statistical distribution to evaluate the test repeatability.
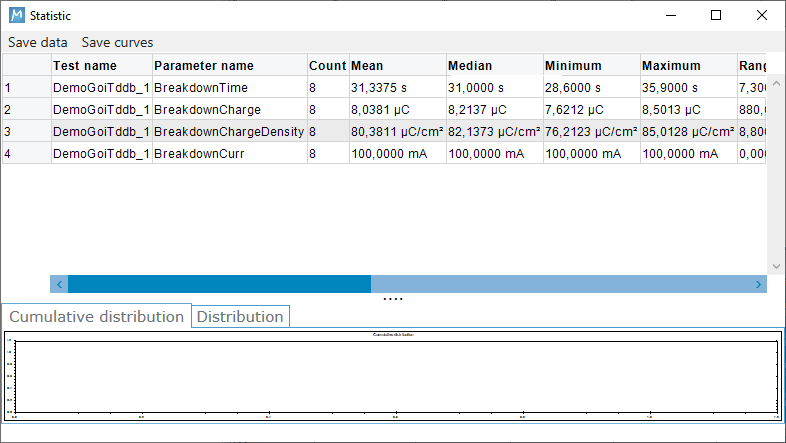
Statistic
Variable List#
The variable list gives an overview of all defined variables within the project. Furthermore, the variables can be selected and placed inside a test via Drag and Drop.
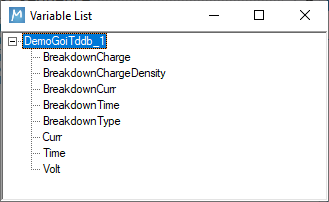
Variable List